the curious case of Kutxabank — part 2
Although my last post hasn’t achieved lots of “success” (I hope because of poor timing of my posting), the story behind it really got under my skin and has de-facto become a small personal investigation. The title might be: The Curious Case of Kutxabank. And we might consider this post as Chapter 2 of the saga.
Summarising Chapter 1 (for those who missed it: https://bit.ly/3OAburL): I realised Kutxabank (a medium-sized bank here in Spain) is constantly rated ~5 stars on hashtag#GoogleMaps across all its branches, while all other banks struggle to get close to 3 (e.g. ABANCA, Bankinter) or even 2 stars (giants like BBVA or Santander). On top of that, the total number of reviews for KB is disproportionate compared to the rest, even though they supposedly have less customers. All very curious.
Today I’ll go one more step down the rabbit hole. I asked myself: who rates these banks on Google Maps? Are they mostly well-trusted users with multiple reviews under their belts or less reliable accounts who wrote one or no reviews at all (and only rated, for example)? My hypothesis was that lots of Kutxabank’s raters belong to the latter group, and that this population significantly differs from the population of raters of other banks.
If this hypothesis was to hold true, then we’d expect the distribution of the number of reviews of KB’s raters to be significantly different from the same distribution for other banks’ raters. And if we were to narrow it down a bit more, we’d expect the proportion of 0-1-reviews-users to be significantly different between the two groups.
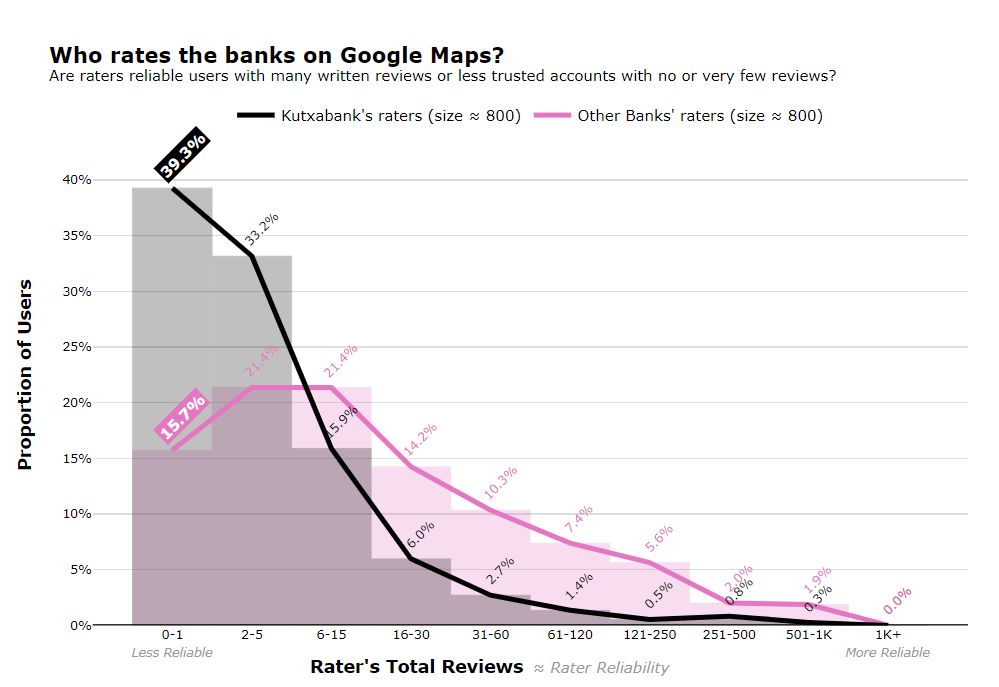
Here I compared information for ~800 Kutxabank’s raters and ~800 raters from other banks (BBVA, Santander, Sabadell, Caixa, Bankinter and ABANCA). It turns out, there is a massive difference according to these data, so big it can be seen with the naked eye. Some key facts: - Roughly 40% of Kutxabank ratings come from very little trusted users with 0 or 1 reviews, compared with 16% for other banks; - ~72% of KB’s ratings come from users with 5 reviews max, compared to 37% for the “control group”. If there was any need, a Pearson’s chi-square test on these data says that the probability of this difference in proportion being due to randomness is less than 0.00000000000000000000001%.
Conclusion: you should really take those ratings with a pinch of salt.